Insights dashboard
The results come together in one admin view. Five headline numbers sit at the top (daily AI usage, fluency, AI champions, automatable work and risk exposure) with the detail beneath.
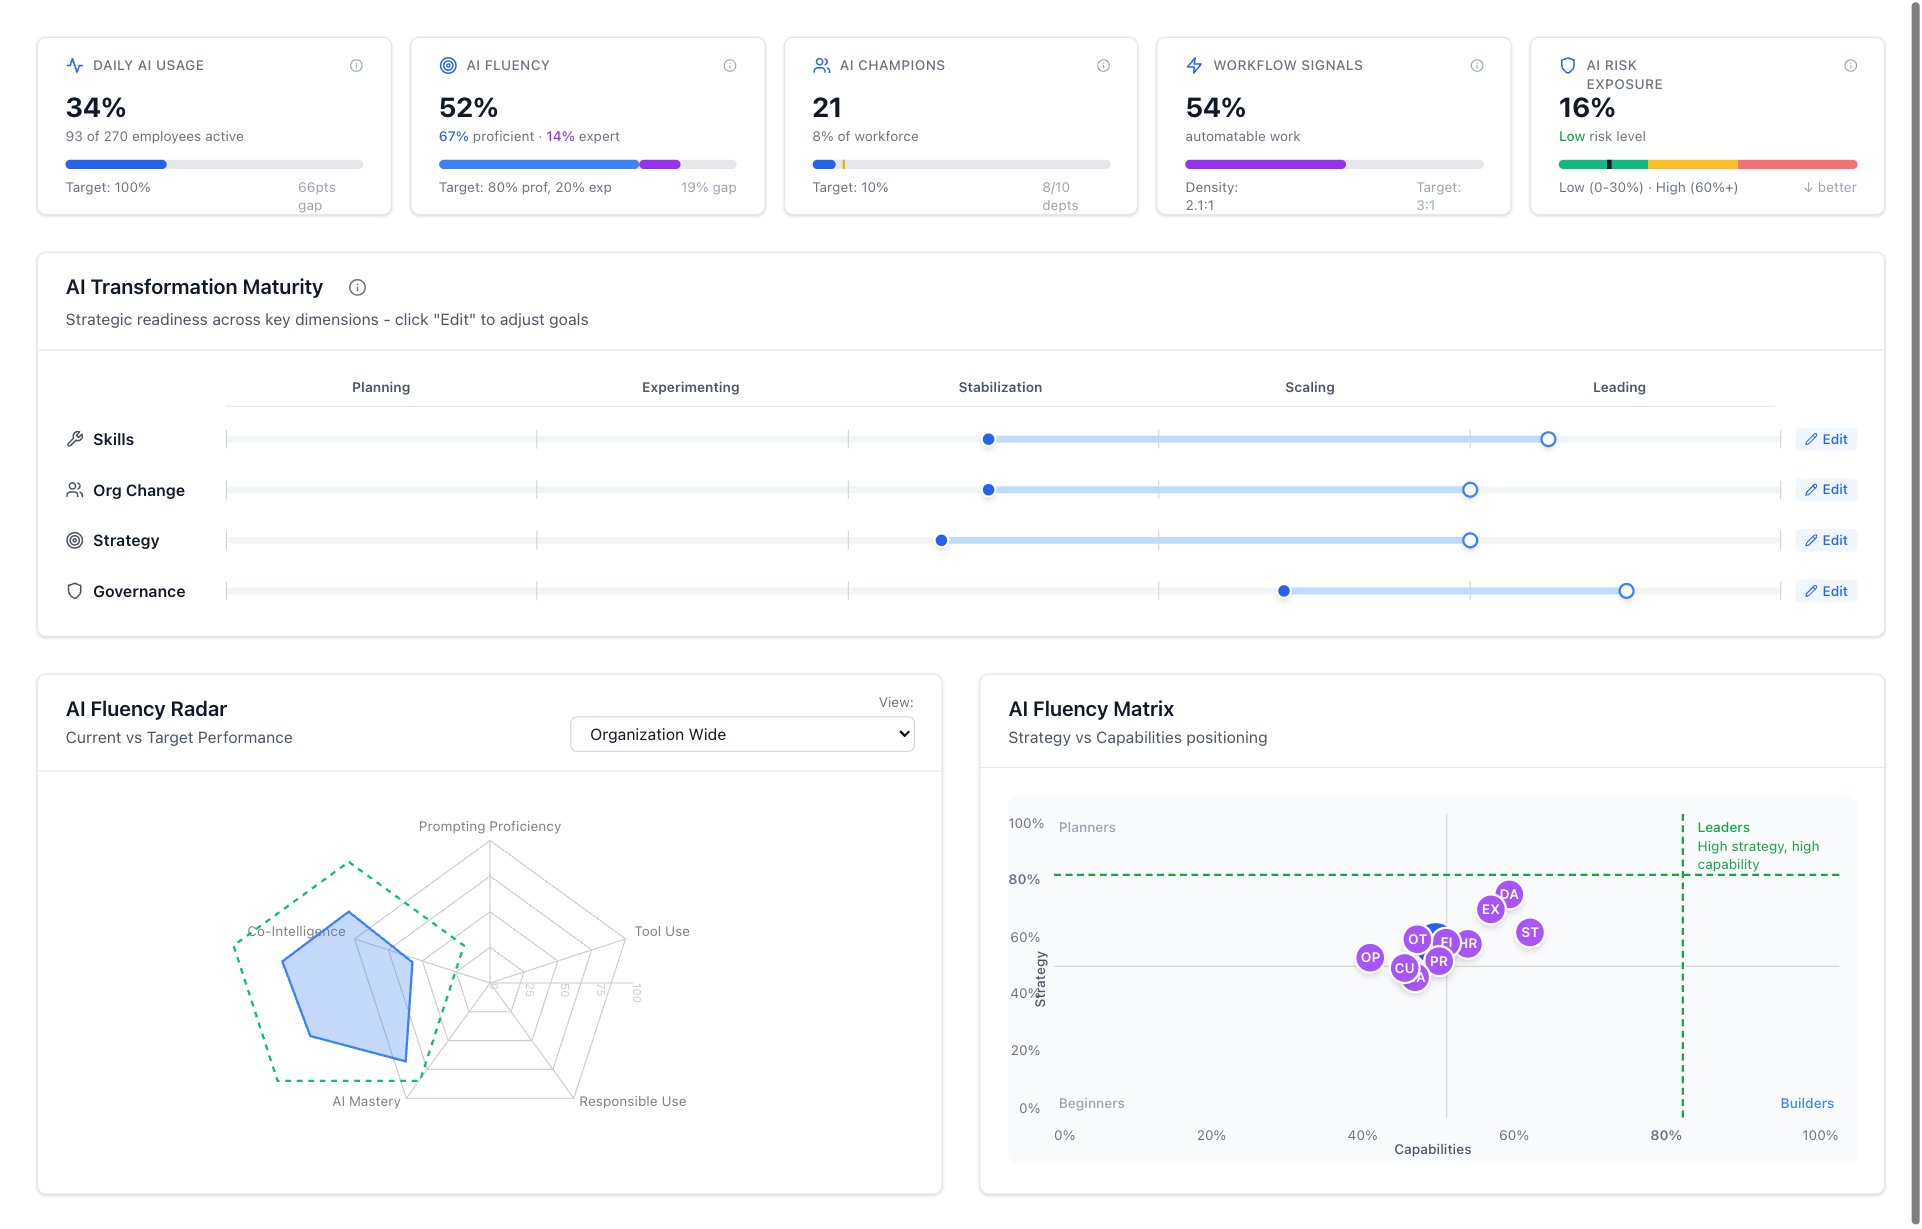 Headline KPIs, the AI Transformation Maturity sliders, the fluency radar and the strategy-vs-capability matrix, benchmarked against peers (demo data).
What you can see
- Headline KPIs: daily AI usage, fluency (proficient vs expert), AI champions, automatable work and risk exposure.
- AI transformation maturity across skills, org change, strategy and governance, with targets you can set per dimension.
- The fluency radar (current vs target) and a strategy-vs-capability matrix that benchmarks the organisation against peers.
- A department heatmap, the priority themes to fix first, and progress over time. All of it can be exported.
Good to know
This is the view a partner walks a client’s leadership team through: evidence of where they stand, how they compare, and what to do next.